Fast Facts, March 2012
For more information about immigrants in Massachusetts, explore our Quick Immigration Statistics: Massachusetts page.
Demographics
948,061: number of immigrants in Massachusetts
14.4 percent: immigrant portion of the state’s population
621,912: number of Massachusetts immigrants in the U.S. 10 or more years
326,149: number of Massachusetts immigrants in the U.S. fewer than 10 years
48.9 percent: share of Massachusetts immigrants who are naturalized citizens
Top 10 Cities by Number of Foreign-Born
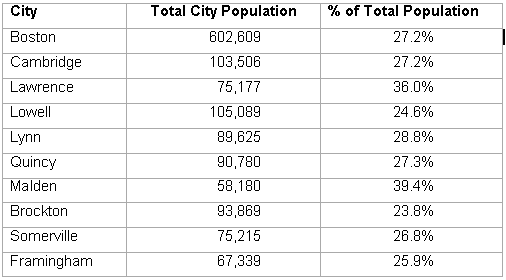
Source: American Community Survey, Five-Year Estimates 2006 – 2010, Table B05002
Region of Birth of Massachusetts Immigrants
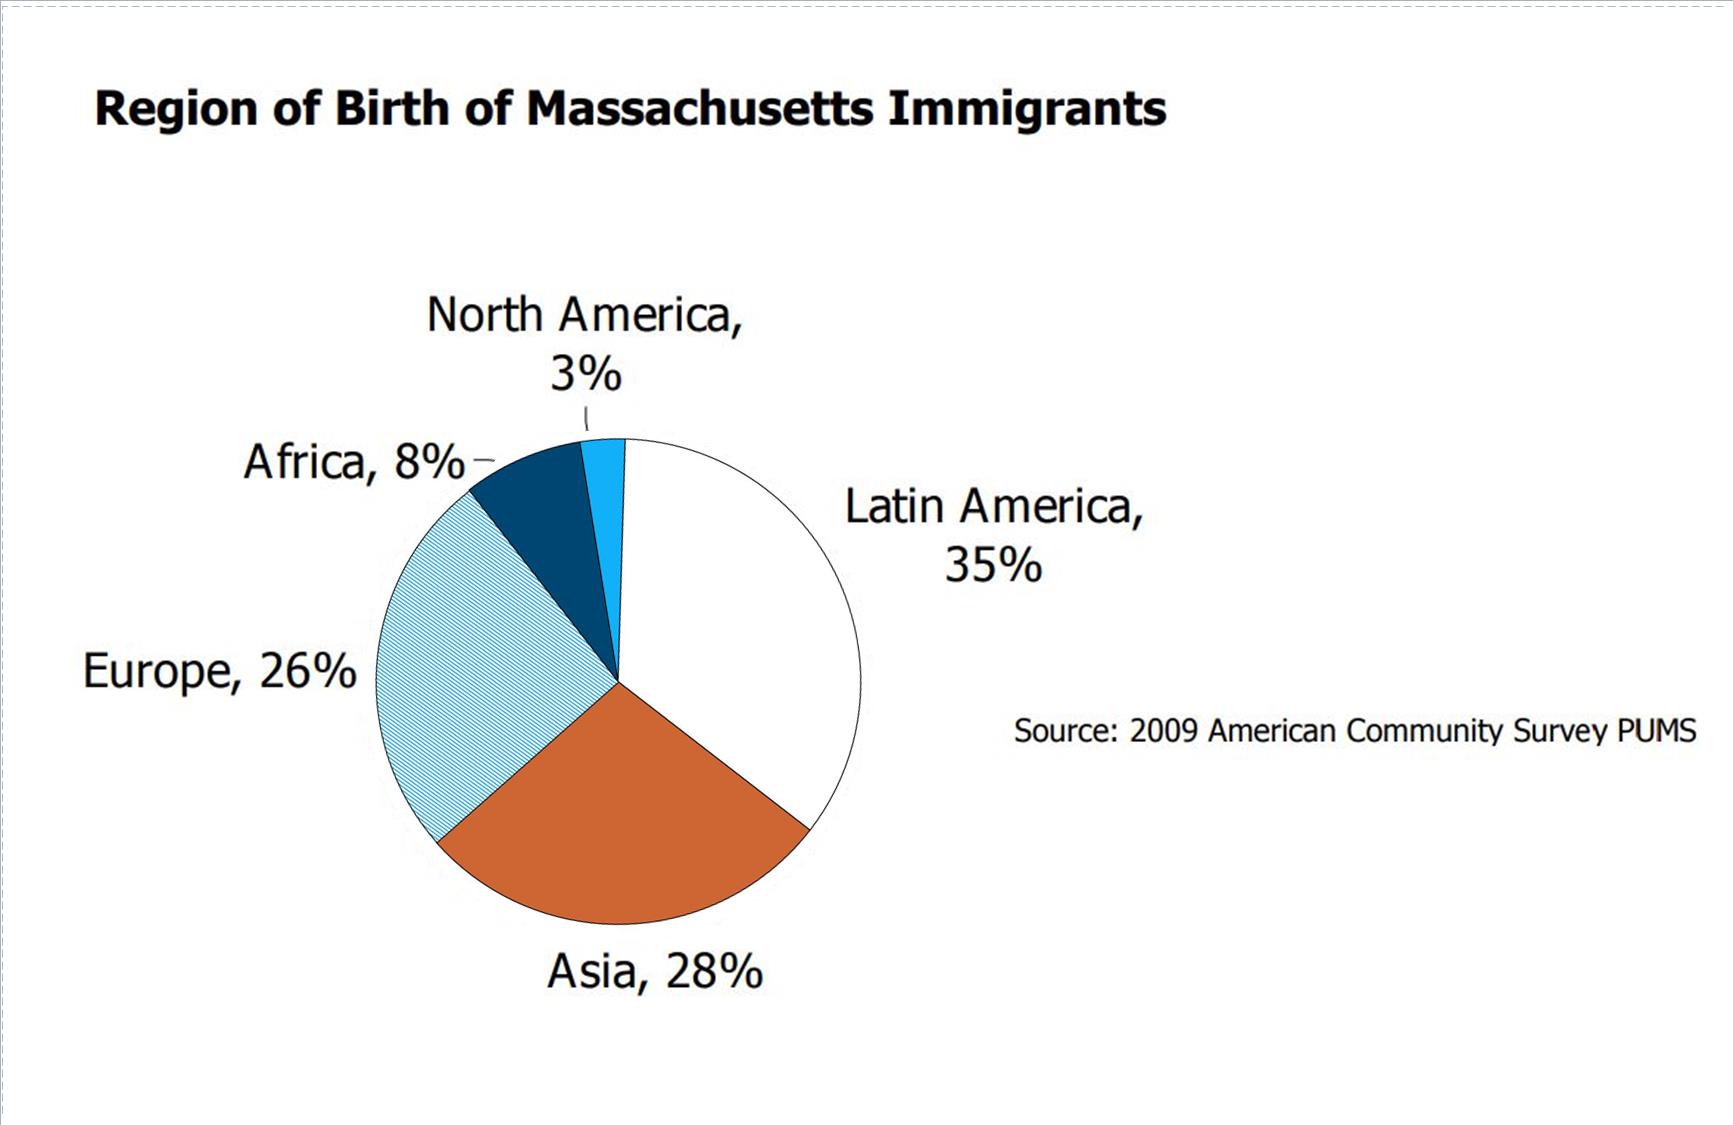
Source: 2009 American Community Survey PUMS
Top Ten Countries of Origin of Massachusetts Immigrants
1. Brazil
2. China
3. Dominican Republic
4. Portugal
5. India
6. Haiti
7. Vietnam
8. Canada
9. El Salvador
10. Guatemala
Income and Jobs
$40,851: immigrants’ average per person income vs. $46,277 for the U.S.-born (11.73 percent less than the U.S.-born)
71.7 percent: share of immigrants participating in the labor force vs. 67.5 percent of the U.S.-born, a significant proportion of the latter being near retirement
50.1 percent: share of Massachusetts immigrants who are in the 18 to 44 age group versus 36.8 percent of U.S.-born Americans. This large cohort of immigrants in the working-age category can help replenish the workforce as baby boomers retire and offset the growing “dependency ratio” of supporting the non-working population.
Top Five Occupation Fields for Immigrants
Immigrants are overrepresented relative to U.S.-born Americans at both the high and low ends of the occupational distribution:
- Building and ground cleaning and maintenance
- Production (workers and supervisors in manufacturing settings)
- Life, physical and social sciences
- Computer and mathematical
- Health care support
Source: American Community Survey, 2009 PUMS
State and Local Taxes
Income Taxes and Number of Filers by Immigration Status
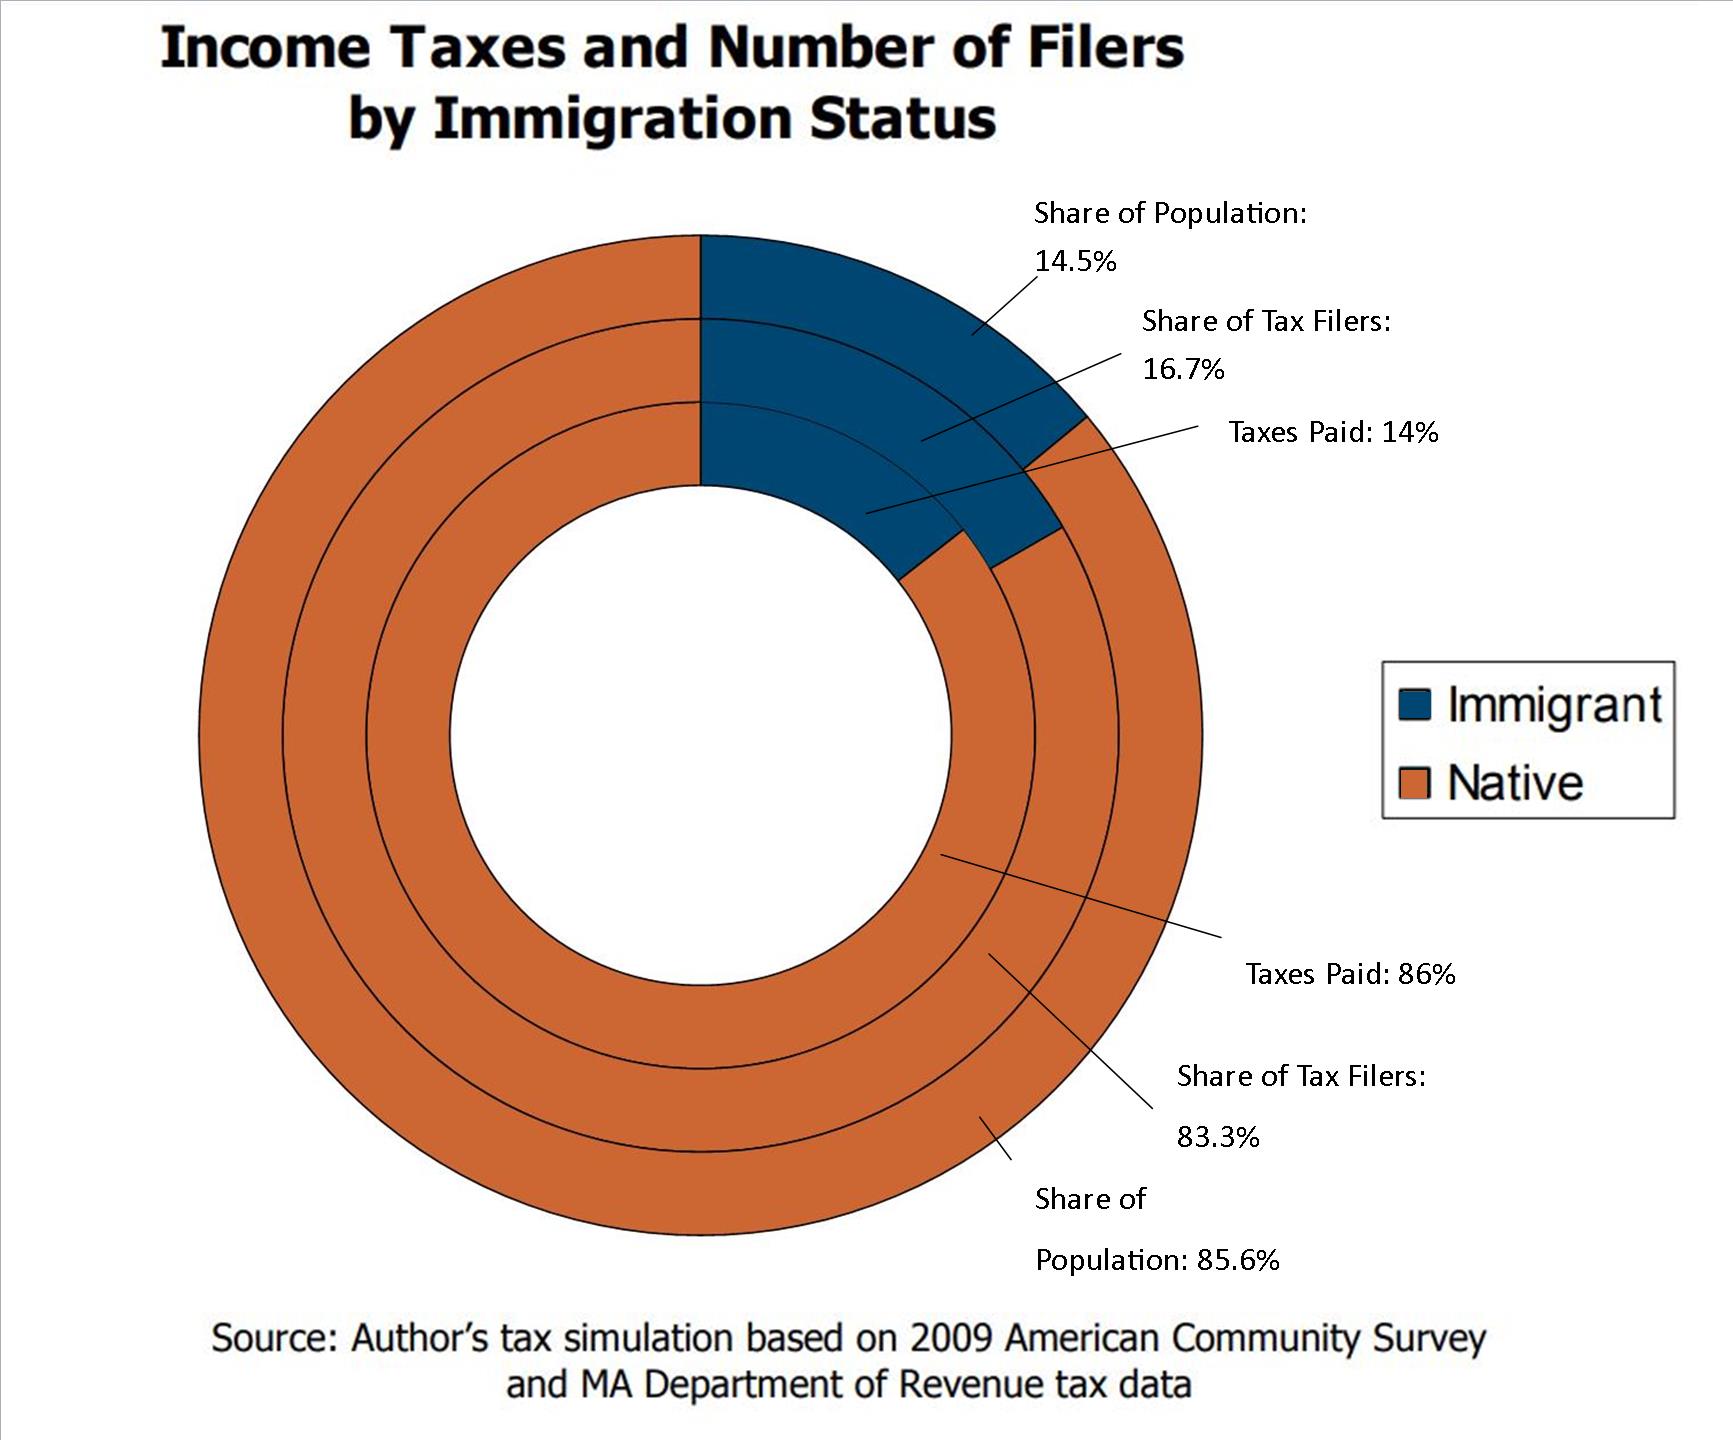
Source: Author’s tax simulation based on 2009 American Community Survey
and MA Department of Revenue tax data
16.7 percent: share of tax filers from immigrant-headed households while immigrants comprise 14.4 percent of the population
$1.36 billion: amount paid in state income taxes by immigrant-headed tax filers
$1.28 billion: amount paid in local property taxes by immigrant-headed households
$338 million: amount paid in sales and excise taxes by immigrant households or 14.3 percent of total Massachusetts sales and excise tax receipts
Transfer Payments
Documented adult immigrants must wait five years to be eligible for public assistance.
Undocumented immigrants cannot receive any transfer payments (government benefits including food stamps, unemployment compensation and social security).
11.7 percent: share of total transfer payments received by immigrants
Social Security
Immigrants are large net contributors to Social Security because they are largely of prime working age, and they pay into the system over a long period of time. This includes undocumented immigrants. The Internal Revenue Service estimates that 70-75 percent of the undocumented population pays Social Security taxes that will not be credited toward future benefits. This creates a net addition to the system estimated at $7 billion annually.
Crime
9.7 percent: share of prison population who are immigrants, which is significantly less than their share of the total population 18 to 64 years of age (17.7 percent).
As immigrants are less likely to commit crimes, costs related to their incarceration are lower than for the U.S.-born.
Total and Incarcerated Population by Immigration Status
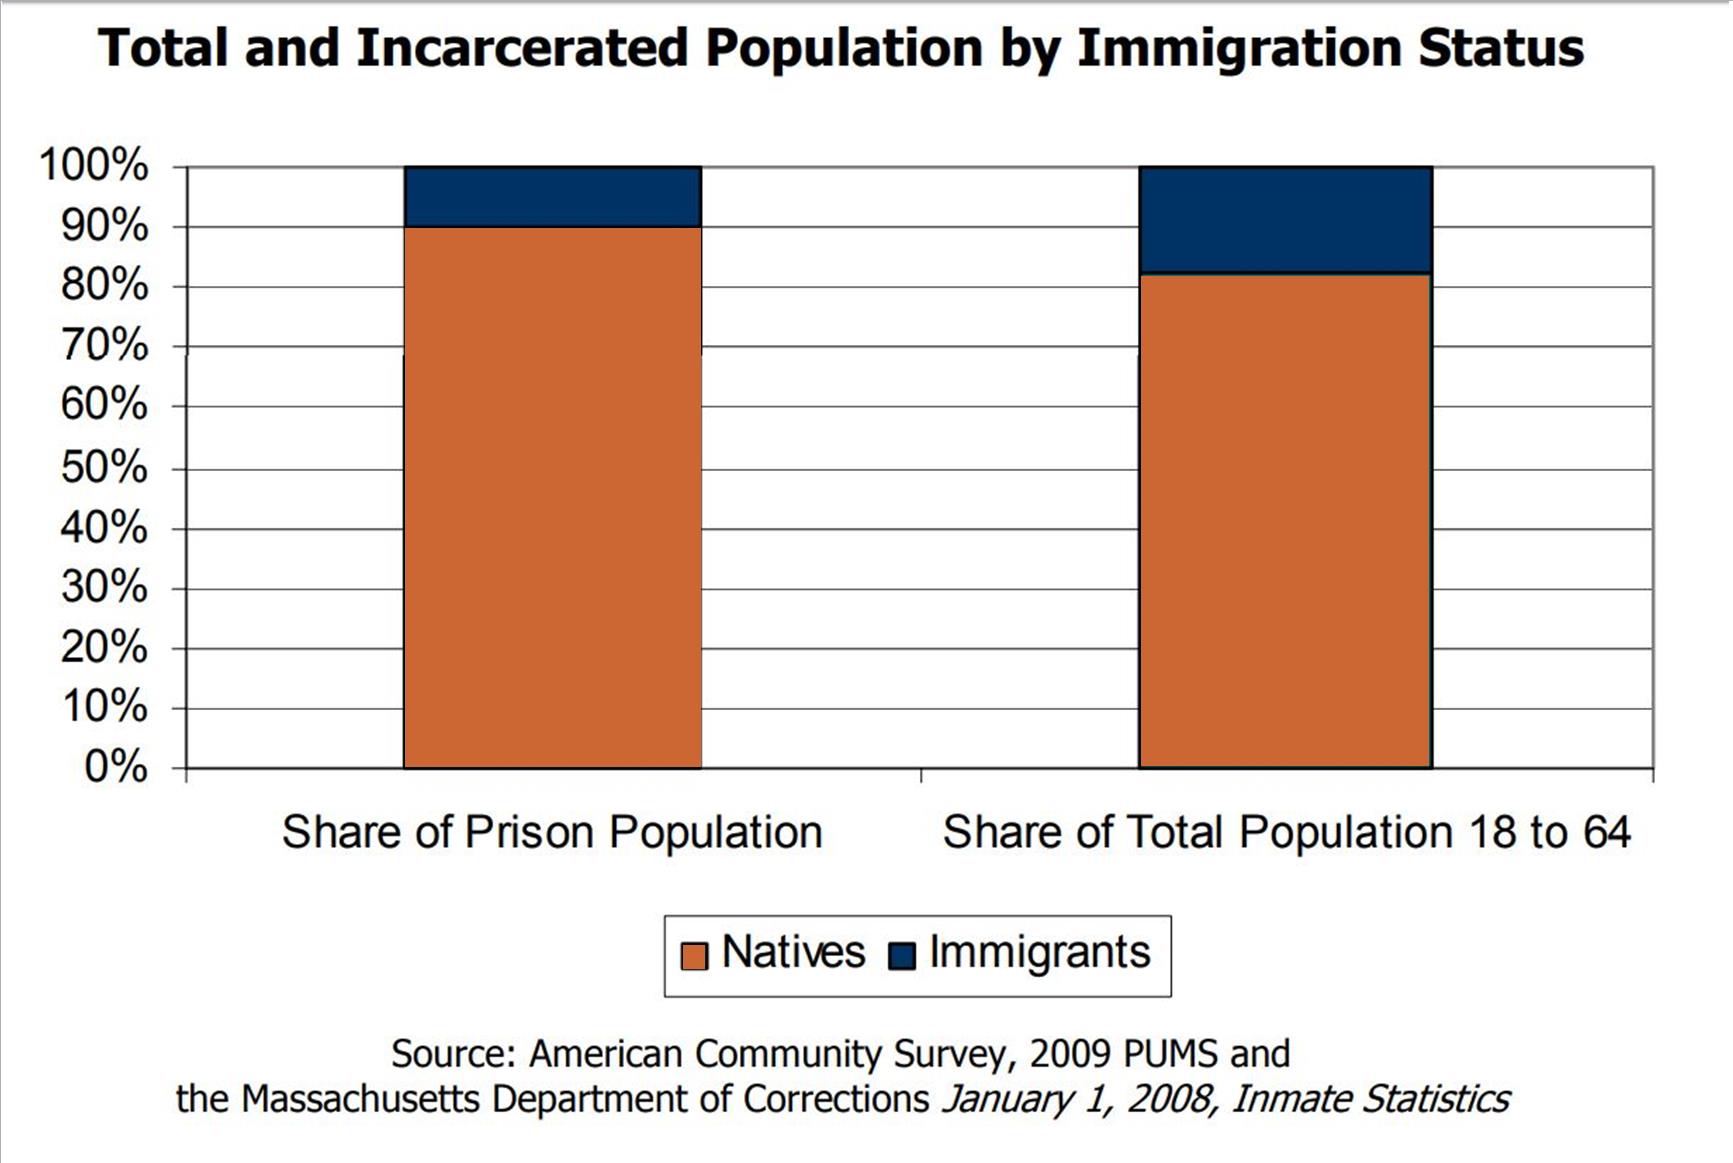
Source: American Community Survey, 2009 PUMS and the Massachusetts Department of Corrections January 1, 2008, Inmate Statistics