There are approximately 1.2 million immigrants in Massachusetts.
The Immigrant Learning Center has compiled a list of quick immigration statistics and facts to answer your most pressing questions about the current immigration landscape in Massachusetts. Our Research and Information page has many studies and reports focused on Massachusetts immigrants, and our Quick U.S. Immigration Statistics page will give you the basics on immigration in the United States.
If you don’t see what you need on this website, our contains more than 1,300 studies from reputable sources, and new reports are added as they become available. If you’re looking for more detailed data or want to examine specific immigrant populations, you can request a free, through the Immigration Data on Demand service from our partner, the Institute for Immigration Research at George Mason University.
If you have questions or suggestions about these Massachusetts Quick Immigration Stats, feel free to contact us at [email protected].
How many immigrants are there in Massachusetts, and who are they?
There are approximately 1.2 million immigrants in Massachusetts.
About one in every six (17.5%) Massachusetts residents is foreign-born.

Source: Institute of Immigration Research analysis of the American Community Survey (ACS) 2018-2022 5-year sample data from Integrated Public Use Microdata Sample
The five largest immigrant populations in Massachusetts are from:
Source: Institute of Immigration Research analysis of the American Community Survey (ACS) 2018-2022 5-year sample data from Integrated Public Use Microdata Sample
Our interactive map, created in collaboration with the Institute for Immigration Research, features more detailed data on Massachusetts immigrants’ locations, countries of origin and more. Click on individual towns and cities to see breakdowns of the foreign-born populations, use the dropdown menu to dig into one of the 11 largest foreign-born populations in the state and use the Data Explorer to learn more about the shares each population makes up by locality.
What is the migration status of most foreign-born people in Massachusetts?
The majority (78%) of immigrants in Massachusetts have authorization.
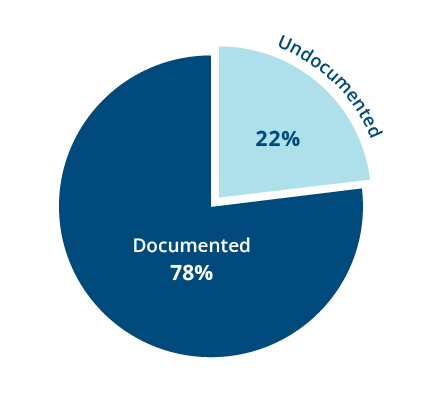
Source: Pew Research Center estimates based on augmented 2016 U.S. Census Bureau data
More than half (54.5%) of all immigrants in Massachusetts have become United States citizens.

Source: Institute of Immigration Research analysis of the American Community Survey (ACS) 2018-2022 5-year sample data from Integrated Public Use Microdata Sample (IPUMS-USA) file
How do immigrants impact the Massachusetts workforce?
Immigrants in Massachusetts have a 79.1 percent rate of workforce participation.*

Source: Institute of Immigration Research analysis of the American Community Survey (ACS) 2018-2022 5-year sample data from Integrated Public Use Microdata Sample
In Massachusetts, 9.8 percent of immigrants are self-employed.
![]()
Source: Institute of Immigration Research analysis of the American Community Survey (ACS) 2018-2022 5-year sample data from Integrated Public Use Microdata Sample
* The workforce participation rate is calculated by dividing the number of people working and those actively seeking work by the number of non-institutionalized, working-age (16-65) civilians.
Nearly one third (31%) of new U.S. businesses are founded by immigrants.

Source: Indicators of Entrepreneurial Activity, UCLA, Jan 2024