There are approximately 74,300 immigrants in Greater Boston.*
*Greater Boston is defined as the Boston-Cambridge-Newton MSA
(Metropolitan Statistical Area) which includes Essex, Middlesex, Norfolk,
Plymouth, and Suffolk counties, as well as Rockingham and Strafford counties in New Hampshire.
Top 10 Immigrant Groups in Greater Boston
The Immigrant Learning Center, with our partner the Institute for Immigration Research at George Mason University, has compiled fact sheets to answer your most pressing questions about the top ten immigrant populations in the Greater Boston area. You can explore the most common occupations, educational backgrounds, median income and more for each immigrant population.
Our Quick Massachusetts Stats page has facts on immigrants living in the full Commonwealth of Massachusetts, and our Quick U.S. Immigration Statistics page will give you the basics on immigration in the United States. If you don’t see what you need here, our contains more than 1,300 studies from reputable sources, including many on Boston immigrants, and new reports are added as they become available. If you’re looking for more detailed data on Boston immigrant populations, you can request a free, through the Immigration Data on Demand service from the Institute for Immigration Research. If you have questions or suggestions about our Greater Boston fact sheets, feel free to contact us at [email protected].
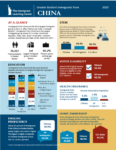
1. China
With almost 14 percent holding doctoral degrees, immigrants from China are among the best educated of Boston immigrant populations. This translates to a large proportion of Chinese immigrants working in STEM (pictured below), particularly in computer, mathematical and science fields.
Immigrants from China lead in STEM*.
Percent of workforce in STEM by population

* Science, Technology, Engineering and Math.
Source: Migration Policy Institute, 2012.
Download this fact sheet on immigrants from China in Greater Boston.
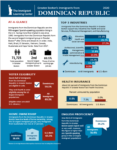
2. Dominican Republic
Immigrants from the Dominican Republic are well-represented in building, grounds cleaning, maintenance, office and administrative support occupations. Of all the large Spanish-speaking Boston immigrant populations, they are the most likely to have a Bachelor’s degree.
Top industries for workers from Dominican Republic in Greater Boston
Percent of workforce by population
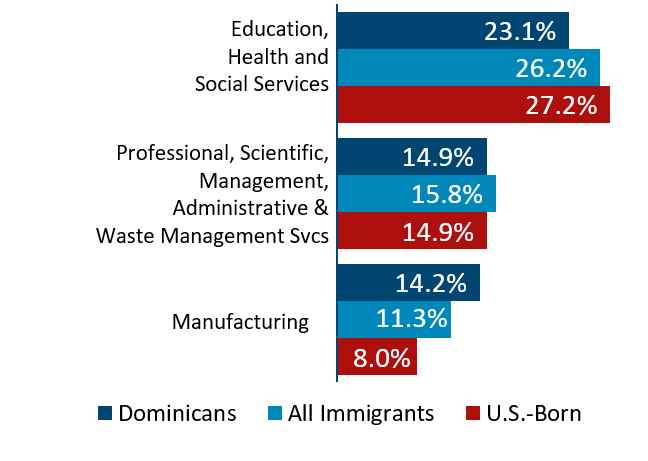
Source: Migration Policy Institute, 2018
Download this fact sheet on immigrants from Dominican Republic in Greater Boston.
3. India
Greater Boston immigrants from India are more than twice as likely as other immigrants to work in STEM, and more than three times as likely as the U.S.-born population. This is reflected in their high levels of educational attainment, with more than half of Indian immigrants earning a graduate degree, and in their high median personal income of $92,735.
Immigrants from India are more highly educated than the U.S.-born or all foreign-born populations in Greater Boston.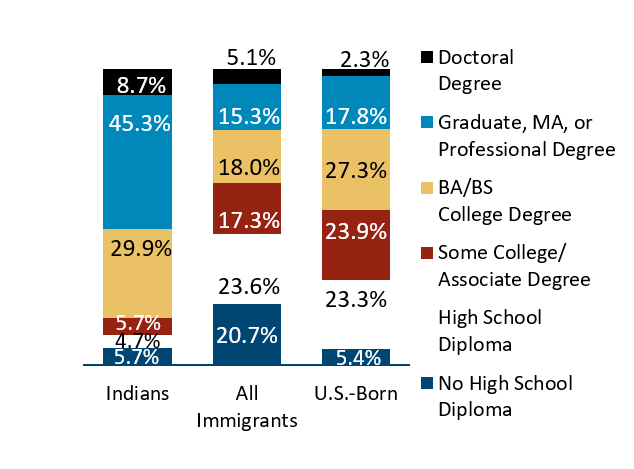
Source: Migration Policy Institute, 2017.
Download this fact sheet on immigrants from India in Greater Boston.
4. Haiti
Immigrants from Haiti are almost twice as likely to work in education, health and social services than other immigrants or the U.S.-born population, and more than five times as likely to be healthcare practitioners. They are also more likely than immigrants in general to be eligible to vote.
Top industries for workers from Haiti in Greater Boston
Percent of workforce by population
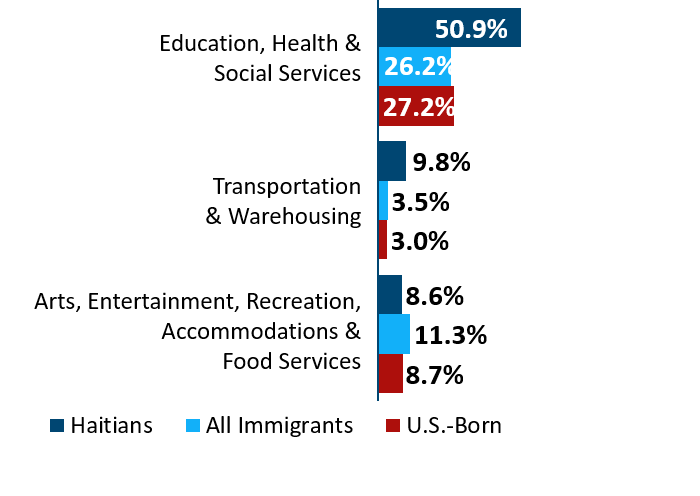
Source: Migration Policy Institute, 2017.
Download this fact sheet on immigrants from Haiti in Greater Boston.
5. Brazil
Immigrants are highly entrepreneurial in general, but Boston’s immigrants from Brazil are the most likely to be self-employed of all the large Boston immigrant populations, with over a quarter starting their own businesses. They also have one of the highest rates of labor force participation and one of the lowest rates of unemployment.
Immigrants from Brazil have the highest self-employment rates of the 10 largest immigrant groups in Greater Boston.
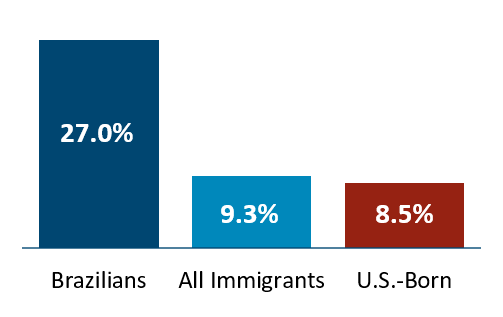
Source: Migration Policy Institute, 2019.
Download this fact sheet on immigrants from Brazil in Greater Boston.
6. El Salvador
Boston immigrants from El Salvador have the highest rate of workforce participation among Boston’s large immigrant populations, at 84.1 percent. They have achieved this despite having the lowest level of educational attainment of the large Boston immigrant groups. Of all the large Spanish-speaking immigrant groups in Greater Boston, they are the most likely to own homes.
Top industries for workers from El Salvador in Greater Boston
Percent of workforce by population
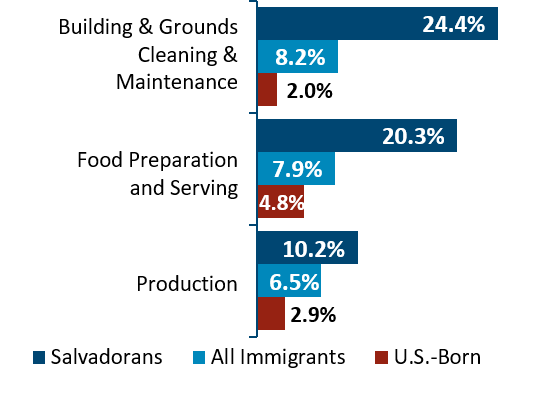
Source: Migration Policy Institute, 2010.
Download this fact sheet on immigrants from El Salvador in Greater Boston.
7. Vietnam
More of Boston’s immigrants from Vietnam have become citizens than any of the other large immigrant populations. Correspondingly, they are the most likely of all the large immigrant groups to be eligible to vote. At $63,261, their median family income is higher than that of immigrants in general.
Immigrants from Vietnam in Greater Boston have the fourth highest labor force participation
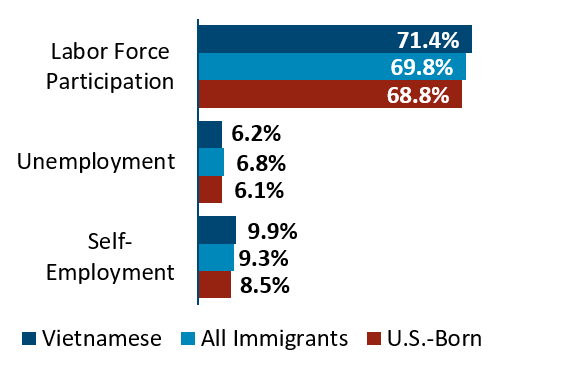
Source: Migration Policy Institute, 2018.
Download this fact sheet on immigrants from Vietnam in Greater Boston.
8. Canada
Immigrants from Canada in Boston are more likely than U.S.-born Greater Bostonians to have insurance, a graduate degree or a house. Almost a quarter work in STEM and they make approximately $2,000 more on average than U.S.-born people. Canadians are more likely to immigrate to the U.S. than they are to any other country.
Immigrants from Canada in Greater Boston are more likely to
own a home than the U.S.-born population
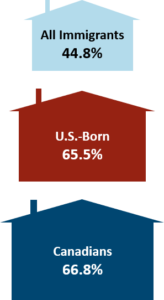
Source: Migration Policy Institute, 2014.
Download this fact sheet on immigrants from Canada in Greater Boston.
9. Guatemala
Immigrants from Guatemala in Boston have higher rates of workforce participation and self-employment than immigrants or U.S.-born people on average. They are well-represented in the maintenance, construction and food service fields. They are also more likely to have high school degrees than Guatemalan immigrants to the U.S. on average.
Immigrants from Guatemala have the third highest labor force participation and the fourth highest self-employment rates among the 10 largest immigrant groups.
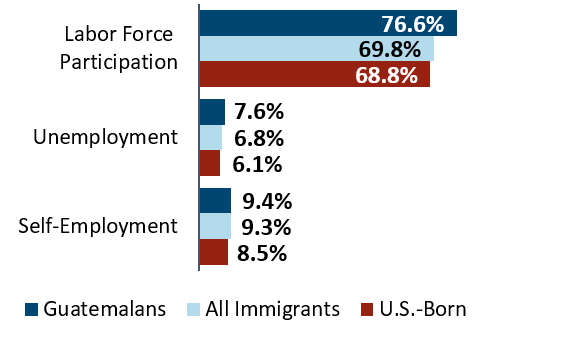
Source: Migration Policy Institute, 2015.
Download this fact sheet on immigrants from Guatemala in Greater Boston.
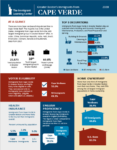
10. Cape Verde
More Cape Verdeans live outside of Cape Verde than in the country itself. More than half of immigrants from Cape Verde in Boston are eligible to vote. They are more than seven times as likely to work in food service than U.S.-born people.
Top industries of workers from Cape Verde in Greater Boston
Percent of workforce by population
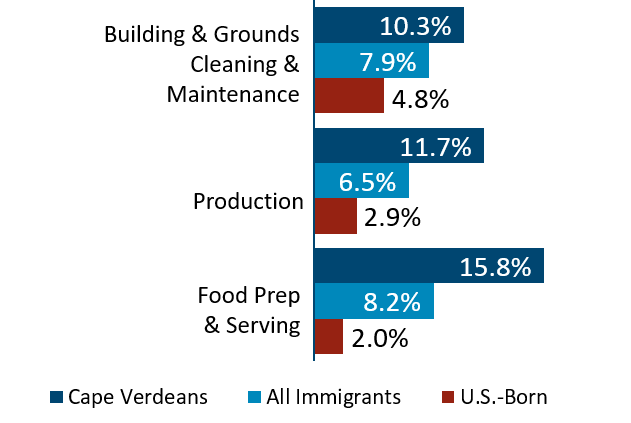
Source: Migration Policy Institute, 2012.
Download this fact sheet on immigrants from Cape Verde in Greater Boston.